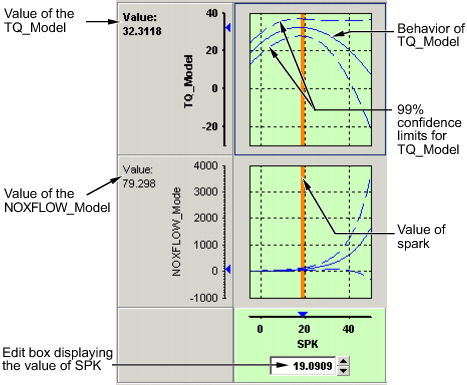
Performing a tradeoff calibration necessarily involves the comparison of two or more models. For example, in this case, the tradeoff allows a calibrator to check that a value of spark that gives peak torque also gives an acceptable value for the NOX flow model.
To select a value of an input, do one of the following:
Drag the red line.
Right-click a graph and select Find the minimum, maximum, or turning point of the model as appropriate (also in the toolbar and Inputs menu).
Click the edit box under the graph and enter the required value.
Once you are satisfied with the value of your variable at this operating point, apply the value to the table by doing one of the following:
Click ![]() (Fill lookup tables with current tradeoff
values and save) in the toolbar.
(Fill lookup tables with current tradeoff
values and save) in the toolbar.
Select Tables > Apply Fill to Table.

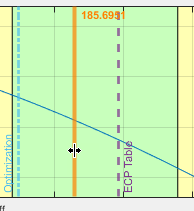
The tradeoff plots show lines for the tradeoff points, table values, and optimization. You can double-click on the lines to set the tables and tradeoff.

Double-click the orange line to update tables to the tradeoff values.
Double-click the blue line to set the tradeoff value to the optimization solution at that operating point.
Double-click the purple line to set the tradeoff value to the table value at that operating point.
Right-clicking a graph enables you to:
Find minimum of model output with respect to the input variable
Find maximum of model output with respect to the input variable
Find turning point of model with respect to the input variable
Reset graph zooms
To zoom in on a particular region, shift-click or click with both mouse buttons simultaneously and drag to define the region as a rectangle.
To set the axes limits to the constraint boundary, select View > Zoom Inside Constraints. This zooms the tradeoff plots inside the constraint boundaries, so you can explore competing objectives in valid regions only. This option reduces the y-axis scale as the plots do not include regions where the model is extrapolating.
To zoom out to the original graph, double-click the selected graph, or use the right-click Reset Graph Zooms option (also in the View menu).
Selecting the View menu offers you the following options:
| Option | Description |
|---|---|
Table History | Opens the History display. |
Configure Hidden Items | Opens a dialog box that allows you to show or hide models and input variables. Select or clear the check boxes to display or hide items. This is useful if you are trading off a large number of models or models that have many factors. |
Display Constraints | Select to toggle constraint displays on and off. Regions outside constraints are shown in yellow on the graphs, as elsewhere in the toolbox. |
Display Common Y Limits | Select to toggle a common y-axis on and off for all the graphs. You can also press CTRL+Y as a shortcut to turn common Y limits on and off. |
Display Confidence Intervals | Select to display the 99% confidence limits for the models. |
Wide Header | Select to toggle graph header size. |
Reset Zoom | Use this to reset if you have zoomed in on areas of interest on the graphs. Zoom in by shift-clicking (or clicking both buttons) and dragging. You can also reset the zooms by double-clicking, or by using the right-click context menu on the graphs. |
Graph Size | Select from the following options for number and size of graphs:
|
Selecting the Inputs menu offers you the following options:
| Option | Description |
|---|---|
Initialize from Tables | Sets all tradeoff points to the table values. |
Initialize from Optimization | Set all tradeoff points to the optimization solution. |
Clear Tradeoff | Clears tradeoff points |
| Set to Table Values | Sets the appropriate input value on the graphs to the value in the table. |
Reset to Saved Values | Resets all the graph input values to the last saved value. |
| Apply Fill to Table | Apply the values from the tradeoff graphs to the selected table cell. The corresponding cell in all tables is filled with the appropriate input, not just the cell in the currently displayed table. For example, if you have graphs for spark and EGR inputs, selecting Apply Fill to Table fills the spark table cell with the spark value in the graphs, and the EGR table cell with the EGR value. |
| Set to Optimization Solution | Set all tradeoff points to the optimization solution. |
| Select Data Point | Select a data point. |
Find Minimum of model vs input factor | Options are only enabled if a graph is selected (click to select, and a blue frame appears around the selected graph). They are also available in the right-click context menu on the graphs. model and
input factor are the model and input
factor displayed in the currently selected graph, for example,
|
Find Maximum of model vs input factor | |
Find Turning Point of model vs input factor |