После анализа можно считать результаты в MATLAB® таблица. Используя таблицу, можно сгенерировать графики или статистику о результатах. Если у вас есть MATLAB Report Generator, можно включать эти таблицы и графики в PDF или отчете HTML.
Считать существующий Polyspace® результаты анализа в таблицу MATLAB, используйте polyspace.CodeProverResults объект сопоставлен результатами.
Например, считать демонстрацию приводит к подпапке polyspace/examples/cxx/Code_Prover_Example/Module_1/CP_Result только для чтения из папки установки MATLAB скопируйте результаты в перезаписываемую папку и считайте их:
resPath = fullfile(polyspaceroot, 'polyspace', ...
    'examples', 'cxx', 'Code_Prover_Example', 'Module_1','CP_Result');

userResPath = tempname;
copyfile(resPath,userResPath);

resObj = polyspace.CodeProverResults(userResPath);
resSummary = getSummary(resObj);
resTable = getResults(resObj);
resSummary и resTable две таблицы MATLAB, содержащие сводные данные и детали результатов Polyspace.В качестве альтернативы можно запустить анализ Polyspace исходных файлов C/C++ с помощью polyspace.Project объект. После анализа, Results свойство объекта содержит результаты. Смотрите Анализ Polyspace Запуска при помощи Скриптов MATLAB.
Можно визуализировать результаты анализа в таблице MATLAB в удобном формате. Если у вас есть MATLAB Report Generator, можно создать PDF или отчет HTML, который содержит визуализацию.
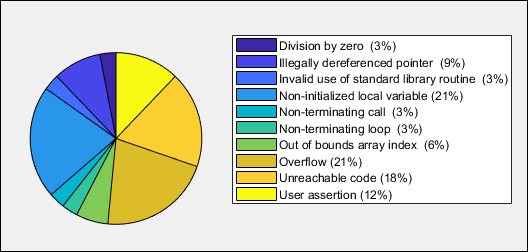
Этот пример создает круговую диаграмму, показывающую распределение красных, серых и оранжевых проверок на этапе выполнения типом проверки, и включает график в отчет.
%% This example shows how to create a pie chart from your results and append
% it to a report.

%% Generate Pie Chart from Polyspace Results

% Copy a demo result set to a temporary folder.
resPath = fullfile(polyspaceroot,'polyspace','examples','cxx', ...
    'Code_Prover_Example','Module_1','CP_Result');
userResPath = tempname;
copyfile(resPath,userResPath);

% Read results into a table.
resObj = polyspace.CodeProverResults(userResPath);
resTable = getResults(resObj);

% Keep results that are run-time checks and eliminate green checks.
matches = (resTable.Family == 'Run-time Check') &...
    (resTable.Color  ~= 'Green');
checkTable = resTable(matches, :);

% Create a pie chart showing distribution of checks.
checkList = removecats(checkTable.Check);
pieChecks = pie(checkList);
labels = get(pieChecks(2:2:end),'String');
set(pieChecks(2:2:end),'String','');
legend(labels,'Location','bestoutside')

% Save the pie chart.
print('file','-dpng');


%% Append Pie Chart to Report
% Requires MATLAB Report Generator

% Create a report object.
import mlreportgen.dom.*;
report = Document('PolyspaceReport','html');

% Add a heading and paragraph to the report.
append(report, Heading(1,'Code Prover Run-Time Errors Graph'));
paragraphText = ['The following graph shows the distribution of ' ...
               'run-time errors in your code.'];
append(report, Paragraph(paragraphText));

% Add the image to the report.
chartObj = Image('file.png');
append(report, chartObj);

% Add another heading and paragraph to the report.
append(report, Heading(1,'Code Prover Run-Time Errors Details'));
paragraphText = ['The following table shows the run-time errors ' ...
               'in your code.'];
append(report, Paragraph(paragraphText));

% Add the table of run-time errors to the report.
reducedInfoTable = checkTable(:,{'File','Function','Check','Color',...
    'Status','Severity','Comment'});
reducedInfoTable = sortrows(reducedInfoTable,[1 2]);
tableObj = MATLABTable(reducedInfoTable);
tableObj.Style = {Border('solid','black'),ColSep('solid','black'),...
    RowSep('solid','black')};
append(report, tableObj);

% Close and view the report in a browser.
close(report);
rptview(report.OutputPath);
polyspace.CodeProverResults: Считайте результаты Code Prover в таблицу.
pie: Создайте круговую диаграмму из категориального массива. Можно альтернативно использовать функцию histogram или heatmap.
Чтобы создать гистограммы, замените pie с histogram в скрипте и удаляют легенды круговой диаграммы.
mlreportgen.dom.Document (MATLAB Report Generator): Создайте объект отчета, который задает формат отчета и где сохранить отчет.
append (MATLAB Report Generator): Добавьте содержимое к существующему отчету.
Когда вы выполняете скрипт, вы видите, что распределение проверяет тип проверки. Скрипт также создает отчет HTML, который содержит график и таблицу проверок Polyspace.
