Чтобы сгенерировать встроенный отчет Веб-представления, создайте экземпляр класса, который задает генератор отчетов (см., Создают Встроенный Генератор отчетов Веб-представления). Затем используйте fill и методы генератора отчетов close.
Например, предположите, что вы хотите создать отчет с помощью примера класса SimulinkDesignVariables (см. Файл Определения класса для Встроенного Веб-представления). Эти команды генерируют и отображают экземпляр того отчета:
model = 'f14';
rptName = sprintf('%sVariables', model);
load_system(model);
rpt = SystemDesignVariables(rptName, model);
fill(rpt);
close(rpt);
close_system(model);
rptview(rptName);
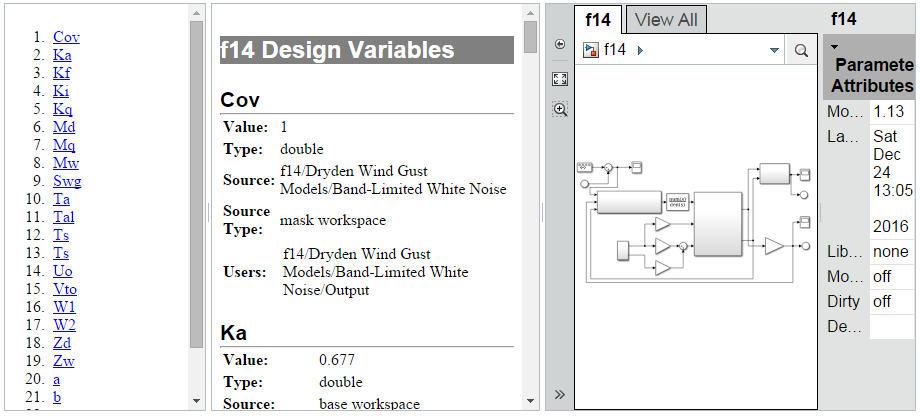
Команда fill(rpt) использует метод fill, который генератор отчетов наследовал от своего базового класса. Этот метод встраивает Веб-представление модели f14 в отчете. Это также вызывает метод fillContent генератора отчетов, который заполняет панель отчетного документа с отчетом относительно переменных, используемых моделью f14.
Получившийся Встроенный отчет Веб-представления показывают.
Для получения информации о навигации к различным частям отчета смотрите Навигацию по Встроенному Отчету Веб-представления.
Этот класс генерирует отчет относительно рабочей области и переменных словаря данных, используемых заданной моделью Simulink®. Этот класс в качестве примера включает значения скалярных числовых переменных только.
classdef SystemDesignVariables < slreportgen.webview.EmbeddedWebViewDocument
    %SystemDesignVariables Report on variables used by a Simulink model
    %   Defines a class of report generators to produce HTML reports on
    %   the workspace and data dictionary variables used by a Simulink
    %   model. The generated report includes this information for
    %   each variable:
    %
    %   Value (if the value is a scalar, numeric value)
    %   Data Type
    %   Source (e.g, path of dictionary containing the variable)
    %   Source Type (e.g., data dictionary or base workspace)
    %   Users (path of blocks that use the variable)
    %
    %   The report includes a Web View of the model with two-way
    %   links between design variable user paths and blocks in the Web
    %   View that use the design variables.
    %

    methods

        function rpt = SystemDesignVariables(reportPath, modelName)

            % Invoke the EmbeddedWebViewDocument constructor, which
            % saves the report path and model name for use by the
            % report's fill methods.
            rpt@slreportgen.webview.EmbeddedWebViewDocument(reportPath,...
                modelName);

            % Turn off duplicate link warnings to avoid warnings for
            % blocks that use multiple design variables.
            rpt.ValidateLinksAndAnchors = false;

            rpt.ExportOptions.IncludeMaskedSubsystems = true;
            rpt.ExportOptions.IncludeSimulinkLibraryLinks = true;
            rpt.ExportOptions.IncludeReferencedModels = true;
        end

        function fillContent(rpt)
            % Fill the Content hole in the report template with design
            % variable information. The rpt variable is a subclass of the
            % DOM Document class, so you can use DOM methods to create,
            % format, and append content to this report.

            %% Set up report
            % Allow use of unqualified names for DOM objects,
            % such as Paragraph instead of mlreportgen.dom.Paragraph.
            import mlreportgen.dom.*

            % Obtain model name, which was saved by the report
            % constructor. getExportedModels returns model names as a
            % cell array, in case a report uses multiple models.
            model = getExportModels(rpt);

            % Extract the model from the cell array. (This report uses
            % only one model.)
            model= model{1};

            %% Create report title
            title = Paragraph(sprintf('%s Design Variables',model));
            title.Style = {Bold,Color('white'),BackgroundColor('gray'), ...
                FontFamily('Helvetica'),FontSize('18pt')};
            append(rpt,title);

            %% Find all variables used by this model.
            vars = Simulink.findVars(model,'ReturnResolvedVar',true);

            %% Loop through the variable information returned by
            % Simulink.findVars, converting the info to formatted document
            % objects and appending the formatted info to the report.
            nVars = numel(vars);
            for i = 1:nVars

                % var is a Simulink.VariableUsage object
                var = vars(i);

                %% Create variable section heading
                varHeading = Heading1(var.Name);
                varHeading.Style = {FontFamily('Helvetica'),...
                    FontSize('16pt'),OuterMargin('0pt','0pt','12pt','0pt')};
                append(rpt,varHeading);
                rule = HorizontalRule;
                rule.Style = {Color('LightGray'), ...
                    OuterMargin('0pt','0pt','0pt','0pt')};
                append(rpt, rule);

                %% Format variable info

                % Convert the variable information into a cell array
                % by using the DOM Table class.
                info = cell(5,1);
                info{1,1} = 'Value:';
                value = var.Value;
                type = class(value);
                if isa(value,'Simulink.Parameter')
                    value = value.Value;
                end
                if isnumeric(value) && isscalar(value)
                    info{1,2} = num2str(value);
                else
                    % Insert logic here to handle non-scalar values.
                    info{1,2} = 'n/a';
                end
                info{2,1} = 'Type:';
                info{2,2} = type;
                info{3,1} = 'Source:';
                info{3,2} = var.Source;
                info{4,1} = 'Source Type:';
                info{4,2} = var.SourceType;
                info{5,1} = 'Users:';

                % var.Users contains a cell array of the paths to the model
                % blocks that use this variable. Create two-way hyperlinks
                % between the paths and the corresponding elements in the
                % Web View of the model embedded in this report by this
                % report's superclass, EmbeddedWebViewDocument. Note that
                % this fails when the Web View element already contains
                % a link, e.g., when the element uses more that one
                % variable. In this case, the element links only to the
                % first variable that it uses.
                nUsers = numel(var.Users);
                users = Table(cell(nUsers,1));
                for u = 1:nUsers
                    userPath = var.Users{u};
                    userLink = createElementTwoWayLink(rpt,...
                                userPath,...
                                mlreportgen.dom.Paragraph(userPath));
                    userLink.Style = {OuterMargin('0pt', '0pt','0pt','0pt')};
                    append(users.entry(u,1),userLink);
                end
                info{5, 2} = users;

                %% Convert the usage info to a table, format the table,
                % and append the table to the rport.
                infoTable = Table(info);
                grp = TableColSpecGroup;
                grp.Style = {OuterMargin('0pt','0pt','0pt','0pt')};
                specs(1) = TableColSpec;
                specs(1).Style = {Bold};
                specs(2) = TableColSpec;
                grp.ColSpecs = specs;
                infoTable.ColSpecGroups = grp;

                append(rpt, infoTable);

            end
        end
    end
end