В этом примере показано, как создать простой отчет, который объясняет и иллюстрирует магические квадраты - матрицы, столбцы, строки и диагонали которых складываются в одно и то же число. Посмотрите magic.
Примечание
Полный пример кода включается после пошаговых инструкций.
Импортируйте базовые классы.
Чтобы исключить необходимость использования полных имен объектов Report и DOM API, используйте эти операторы. Например, вместо использования mlreportgen.report.Report, можно использовать Report.
import mlreportgen.report.*
import mlreportgen.dom.*
Создайте объект отчета.
Создайте объект отчета. Использование 'magic' как имя файла и его 'html' как тип отчета.
rpt = Report('magic','html'); Для настройки свойств, которые применяются ко всему отчету, смотрите mlreportgen.report.Report.
Добавить страницу заголовка.
Создайте титульную страницу и укажите ее заголовок, подзаголовок и автора. Затем добавьте страницу заголовка к отчету.
tp = TitlePage;
tp.Title = 'Magic Squares';
tp.Subtitle = 'Columns, Rows, Diagonals: All Equal Sums';
tp.Author = 'Albrecht Durer';
append(rpt,tp);
Для настройки дополнительных свойств страницы заголовка смотрите mlreportgen.report.TitlePage.
Добавить таблицы содержимого.
Добавьте в отчет объект таблицы содержимого по умолчанию.
append(rpt,TableOfContents);
Для настройки таблицы содержимого смотрите mlreportgen.report.TableOfContents.
Добавить главу и разделы главы.
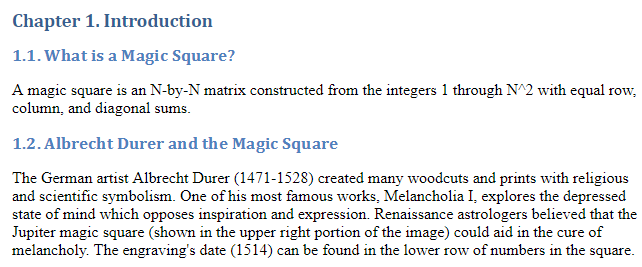
Создайте объект главы для введения и укажите заголовок главы. Добавить раздел, добавить абзац в этот раздел и добавить этот раздел в главу. Создайте другой раздел и добавьте к нему абзац.
ch1 = Chapter;
ch1.Title = 'Introduction';
sec1 = Section;
sec1.Title = 'What is a Magic Square?';
para = Paragraph(['A magic square is an N-by-N matrix '...
'constructed from the integers 1 through N^2 '...
'with equal row, column, and diagonal sums.']);
append(sec1,para)
append(ch1,sec1)
sec2 = Section;
sec2.Title = 'Albrecht Durer and the Magic Square';
para = Paragraph([ ...
'The German artist Albrecht Durer (1471-1528) created '...
'many woodcuts and prints with religious and '...
'scientific symbolism. One of his most famous works, '...
'Melancholia I, explores the depressed state of mind '...
'which opposes inspiration and expression. '...
'Renaissance astrologers believed that the Jupiter '...
'magic square (shown in the upper right portion of '...
'the image) could aid in the cure of melancholy. The '...
'engraving''s date (1514) can be found in the '...
'lower row of numbers in the square.']);
append(sec2,para)
append(ch1,sec2)
Для получения информации о настройке глав и разделов см. mlreportgen.report.Chapter и mlreportgen.report.Section соответственно.
Добавьте рисунок.
Создайте изображение Дюрера в окне рисунка. Создайте изображение на фигуре MATLAB. Добавить рисунок во второй раздел вводной главы, а затем добавить главу в отчет.
durerImage=load(which('durer.mat'),'-mat');
figure('Units','Pixels','Position',...
[200 200 size(durerImage.X,2)*.5 ...
size(durerImage.X,1)*.5 ]);
image(durerImage.X);
colormap(durerImage.map);
axis('image');
set(gca,'Xtick',[],'Ytick',[],...
'Units','normal','Position',[0 0 1 1]);
append(sec2,Figure)
append(rpt,ch1)
close gcf 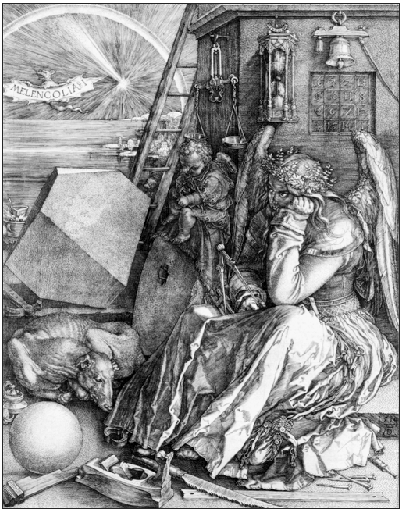
Для получения дополнительной информации о рисунках смотрите mlreportgen.report.Figure. Для получения дополнительной информации о изображениях смотрите mlreportgen.report.FormalImage.
Добавьте таблицу.
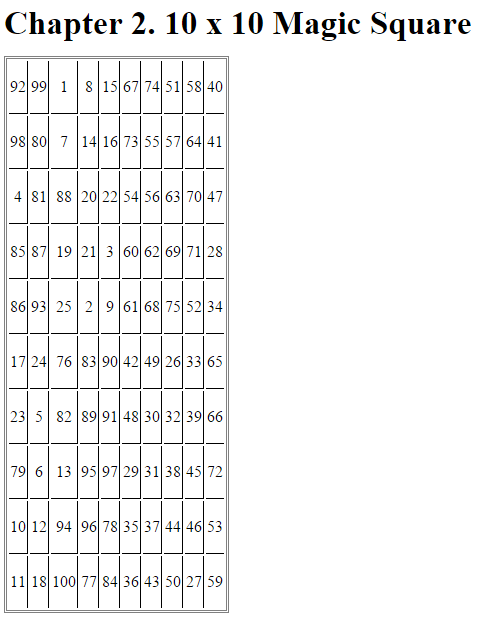
Добавьте другой объект главы и укажите его заголовок. Задайте код MATLAB, чтобы создать магический квадрат 10 на 10. Добавьте результаты в таблицу и установите следующие свойства таблицы:
Диафрагмы строк и столбцов
Граница таблицы
Выравнивание записей таблицы
Затем добавьте таблицу в главу и главу в отчет.
ch2 = Chapter();
ch2.Title = sprintf('10 x 10 Magic Square');

square = magic(10);
tbl = Table(square);

tbl.Style = {...
    RowSep('solid','black','1px'),...
    ColSep('solid','black','1px'),};
tbl.Border = 'double';
tbl.TableEntriesStyle = {HAlign('center')};

append(ch2,tbl);
append(rpt,ch2);
Для получения дополнительной информации о таблицах смотрите mlreportgen.dom.Table.
Добавьте фигуру MATLAB к главе.
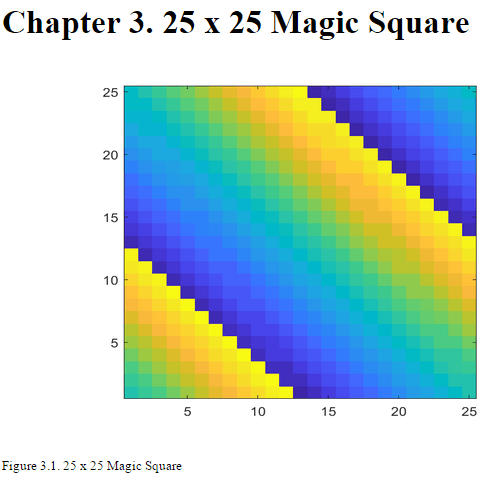
Добавьте другой объект главы и укажите его заголовок. Задайте код MATLAB, чтобы создать магический квадрат 25 на 25 и закодированную в цвете рисунок магического квадрата. Затем создайте объект рисунка и установите его высоту, ширину и подпись. Добавить рисунок в главу и главу в отчет.
ch3 = Chapter();
ch3.Title = sprintf('25 x 25 Magic Square');

square = magic(25);
clf;
imagesc(square)
set(gca,'Ydir','normal')
axis equal
axis tight

fig = Figure(gcf);
fig.Snapshot.Height = '4in';
fig.Snapshot.Width = '6in';
fig.Snapshot.Caption = sprintf('25 x 25 Magic Square');

append(ch3,fig);
append(rpt,ch3);
delete(gcf)
Для получения дополнительной информации о рисунках смотрите mlreportgen.report.Figure.
Закройте и запустите отчет.
close(rpt)
rptview(rpt)
Полный код:
import mlreportgen.report.*
import mlreportgen.dom.*
rpt = Report('magic','html');

tp = TitlePage;
tp.Title = 'Magic Squares';
tp.Subtitle = 'Columns, Rows, Diagonals: All Equal Sums';
tp.Author = 'Albrecht Durer';
append(rpt,tp);
append(rpt,TableOfContents);

ch1 = Chapter;
ch1.Title = 'Introduction';
sec1 = Section;
sec1.Title = 'What is a Magic Square?';
para = Paragraph(['A magic square is an N-by-N matrix '...
'constructed from the integers 1 through N^2 '...
'with equal row, column, and diagonal sums.']);
append(sec1,para)
append(ch1,sec1)

sec2=Section;
sec2.Title = 'Albrecht Durer and the Magic Square';
para = Paragraph([ ...
'The German artist Albrecht Durer (1471-1528) created '...
'many woodcuts and prints with religious and '...
'scientific symbolism. One of his most famous works, '...
'Melancholia I, explores the depressed state of mind '...
'which opposes inspiration and expression. '...
'Renaissance astrologers believed that the Jupiter '...
'magic square (shown in the upper right portion of '...
'the image) could aid in the cure of melancholy. The '...
'engraving''s date (1514) can be found in the '...
'lower row of numbers in the square.']);
append(sec2,para)
append(ch1,sec2)

durerImage=load(which('durer.mat'),'-mat');
figure('Units','Pixels','Position',...
[200 200 size(durerImage.X,2)*.5 ...
size(durerImage.X,1)*.5 ]);
image(durerImage.X);
colormap(durerImage.map);
axis('image');
set(gca,'Xtick',[],'Ytick',[],...
'Units','normal','Position',[0 0 1 1]);
append(sec2,Figure)
append(rpt,ch1)
close gcf

ch2 = Chapter();
ch2.Title = sprintf('10 x 10 Magic Square');
square = magic(10);
tbl = Table(square);
tbl.Style = {...
RowSep('solid','black','1px'),...
ColSep('solid','black','1px'),};
tbl.Border = 'double';
tbl.TableEntriesStyle = {HAlign('center')};
append(ch2,tbl);
append(rpt,ch2);

ch3 = Chapter();
ch3.Title = sprintf('25 x 25 Magic Square');
square = magic(25);
clf;
imagesc(square)
set(gca,'Ydir','normal')
axis equal
axis tight
fig = Figure(gcf);
fig.Snapshot.Height = '4in';
fig.Snapshot.Width = '6in';
fig.Snapshot.Caption = sprintf('25 x 25 Magic Square');
append(ch3,fig);
append(rpt,ch3);

delete(gcf)
close(rpt)
rptview(rpt)