В этом примере показано, как создать простой отчет, который объясняет и иллюстрирует магические квадраты – матрицы, столбцы которых, строки и диагонали каждый составляет в целом тот же номер. Смотрите magic.
Примечание
Полный пример кода включен после постепенных инструкций.
Импортируйте базовые классы.
Чтобы избавить от необходимости использовать полностью определенные имена объектов Отчета и ДОМА АПИ, используйте эти операторы. Например, вместо того, чтобы использовать mlreportgen.report.Report, можно использовать Report.
import mlreportgen.report.*
import mlreportgen.dom.*
Создайте объект отчета.
Создайте объект отчета. Используйте 'magic' как его имя файла и 'html' как его тип отчета.
rpt = Report('magic','html'); Чтобы настроить свойства, которые применяются к целому отчету, смотрите mlreportgen.report.Report.
Добавьте титульный лист.
Создайте титульный лист и задайте его заголовок, подзаголовок и автора. Затем добавьте титульный лист в отчет.
tp = TitlePage;
tp.Title = 'Magic Squares';
tp.Subtitle = 'Columns, Rows, Diagonals: All Equal Sums';
tp.Author = 'Albrecht Durer';
append(rpt,tp);
Чтобы настроить дополнительные свойства титульного листа, смотрите mlreportgen.report.TitlePage.
Добавьте оглавление.
Добавьте объект оглавления по умолчанию в отчет.
append(rpt,TableOfContents);
Чтобы настроить оглавление, смотрите mlreportgen.report.TableOfContents.
Добавьте разделы главы и главы.
Создайте объект главы для введения и задайте заголовок главы. Добавьте раздел, добавьте абзац в тот раздел и добавьте что раздел в главу. Создайте другой раздел и добавьте абзац в него.
ch1 = Chapter;
ch1.Title = 'Introduction';
sec1 = Section;
sec1.Title = 'What is a Magic Square?';
para = Paragraph(['A magic square is an N-by-N matrix '...
'constructed from the integers 1 through N^2 '...
'with equal row, column, and diagonal sums.']);
append(sec1,para)
append(ch1,sec1)
sec2 = Section;
sec2.Title = 'Albrecht Durer and the Magic Square';
para = Paragraph([ ...
'The German artist Albrecht Durer (1471-1528) created '...
'many woodcuts and prints with religious and '...
'scientific symbolism. One of his most famous works, '...
'Melancholia I, explores the depressed state of mind '...
'which opposes inspiration and expression. '...
'Renaissance astrologers believed that the Jupiter '...
'magic square (shown in the upper right portion of '...
'the image) could aid in the cure of melancholy. The '...
'engraving''s date (1514) can be found in the '...
'lower row of numbers in the square.']);
append(sec2,para)
append(ch1,sec2)
Для получения информации о настройке глав и разделов, смотрите mlreportgen.report.Chapter и mlreportgen.report.Section соответственно.
Добавьте фигуру.
Создайте изображение Дюрера в окне рисунка. Создайте изображение в фигуре MATLAB. Добавьте фигуру во второй раздел вводной главы и затем, добавьте главу в отчет.
durerImage=load(which('durer.mat'),'-mat');
figure('Units','Pixels','Position',...
[200 200 size(durerImage.X,2)*.5 ...
size(durerImage.X,1)*.5 ]);
image(durerImage.X);
colormap(durerImage.map);
axis('image');
set(gca,'Xtick',[],'Ytick',[],...
'Units','normal','Position',[0 0 1 1]);
append(sec2,Figure)
append(rpt,ch1)
close gcf 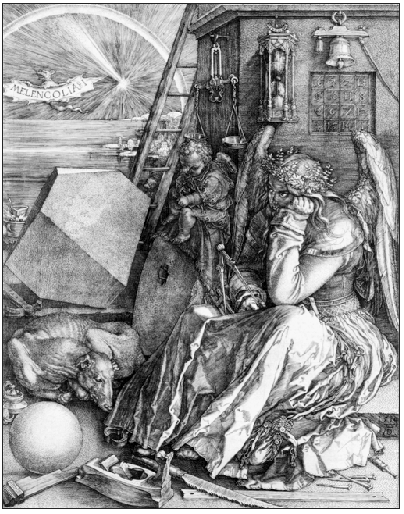
Для получения дополнительной информации о фигурах смотрите mlreportgen.report.Figure. Для получения дополнительной информации об изображениях смотрите mlreportgen.report.FormalImage.
Добавьте таблицу.
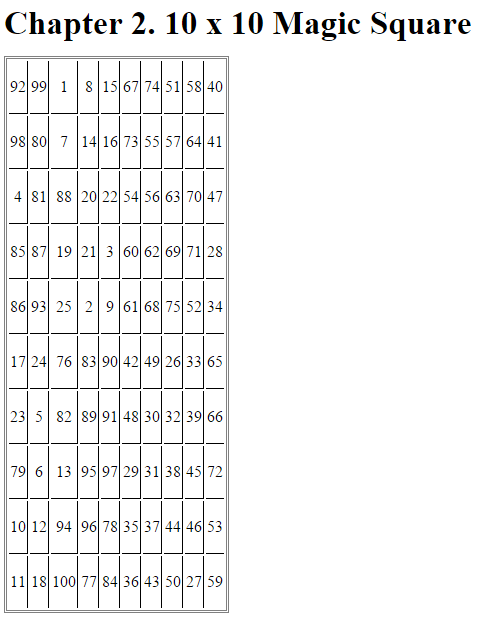
Добавьте, что другая глава возражает и задает свой заголовок. Задайте код MATLAB, чтобы создать 10 10 магический квадрат. Добавьте результаты в таблицу и установите эти свойства таблиц:
Диафрагмы строки и столбца
Граница таблицы
Выравнивание записей таблицы
Затем добавьте таблицу в главу и главу к отчету.
ch2 = Chapter();
ch2.Title = sprintf('10 x 10 Magic Square');

square = magic(10);
tbl = Table(square);

tbl.Style = {...
    RowSep('solid','black','1px'),...
    ColSep('solid','black','1px'),};
tbl.Border = 'double';
tbl.TableEntriesStyle = {HAlign('center')};

append(ch2,tbl);
append(rpt,ch2);
Для получения дополнительной информации о таблицах смотрите mlreportgen.dom.Table.
Добавьте фигуру MATLAB в главу.
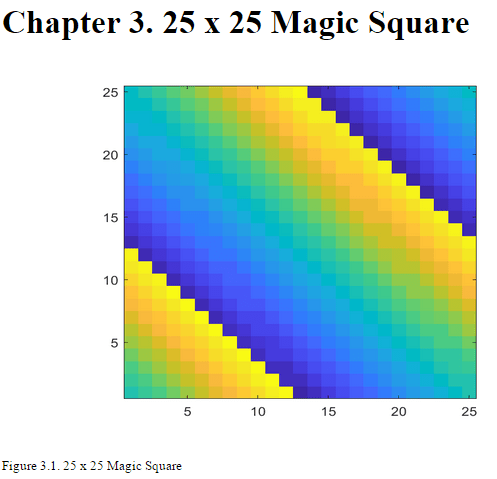
Добавьте, что другая глава возражает и задает свой заголовок. Задайте код MATLAB, чтобы создать 25 25 магический квадрат и фигуру, на которую наносят цветную маркировку, магического квадрата. Затем создайте объект фигуры и установите его высоту, ширину и заголовок. Добавьте фигуру в главу и главу к отчету.
ch3 = Chapter();
ch3.Title = sprintf('25 x 25 Magic Square');

square = magic(25);
clf;
imagesc(square)
set(gca,'Ydir','normal')
axis equal
axis tight

fig = Figure(gcf);
fig.Snapshot.Height = '4in';
fig.Snapshot.Width = '6in';
fig.Snapshot.Caption = sprintf('25 x 25 Magic Square');

append(ch3,fig);
append(rpt,ch3);
delete(gcf)
Для получения дополнительной информации о фигурах смотрите mlreportgen.report.Figure.
Закройте и запустите отчет.
close(rpt)
rptview(rpt)
Полный код:
import mlreportgen.report.*
import mlreportgen.dom.*
rpt = Report('magic','html');

tp = TitlePage;
tp.Title = 'Magic Squares';
tp.Subtitle = 'Columns, Rows, Diagonals: All Equal Sums';
tp.Author = 'Albrecht Durer';
append(rpt,tp);
append(rpt,TableOfContents);

ch1 = Chapter;
ch1.Title = 'Introduction';
sec1 = Section;
sec1.Title = 'What is a Magic Square?';
para = Paragraph(['A magic square is an N-by-N matrix '...
'constructed from the integers 1 through N^2 '...
'with equal row, column, and diagonal sums.']);
append(sec1,para)
append(ch1,sec1)

sec2=Section;
sec2.Title = 'Albrecht Durer and the Magic Square';
para = Paragraph([ ...
'The German artist Albrecht Durer (1471-1528) created '...
'many woodcuts and prints with religious and '...
'scientific symbolism. One of his most famous works, '...
'Melancholia I, explores the depressed state of mind '...
'which opposes inspiration and expression. '...
'Renaissance astrologers believed that the Jupiter '...
'magic square (shown in the upper right portion of '...
'the image) could aid in the cure of melancholy. The '...
'engraving''s date (1514) can be found in the '...
'lower row of numbers in the square.']);
append(sec2,para)
append(ch1,sec2)

durerImage=load(which('durer.mat'),'-mat');
figure('Units','Pixels','Position',...
[200 200 size(durerImage.X,2)*.5 ...
size(durerImage.X,1)*.5 ]);
image(durerImage.X);
colormap(durerImage.map);
axis('image');
set(gca,'Xtick',[],'Ytick',[],...
'Units','normal','Position',[0 0 1 1]);
append(sec2,Figure)
append(rpt,ch1)
close gcf

ch2 = Chapter();
ch2.Title = sprintf('10 x 10 Magic Square');
square = magic(10);
tbl = Table(square);
tbl.Style = {...
RowSep('solid','black','1px'),...
ColSep('solid','black','1px'),};
tbl.Border = 'double';
tbl.TableEntriesStyle = {HAlign('center')};
append(ch2,tbl);
append(rpt,ch2);

ch3 = Chapter();
ch3.Title = sprintf('25 x 25 Magic Square');
square = magic(25);
clf;
imagesc(square)
set(gca,'Ydir','normal')
axis equal
axis tight
fig = Figure(gcf);
fig.Snapshot.Height = '4in';
fig.Snapshot.Width = '6in';
fig.Snapshot.Caption = sprintf('25 x 25 Magic Square');
append(ch3,fig);
append(rpt,ch3);

delete(gcf)
close(rpt)
rptview(rpt)